Most fitness benchmarks were built for specialists.
Open a strength chart, and the numbers assume you spend your recovery days on the couch eating in a caloric surplus, never running farther than the gym parking lot. Open a running pace chart, and the times assume you carry minimal upper-body mass and dedicate every ounce of lower-body recovery to aerobic volume.
If you train exclusively for one discipline, specialist charts work fine. If you are a hybrid athlete—chasing heavy barbell numbers and fast road times inside the same training week—specialist charts can quietly distort your programming.
Below are the complete reference standards for Standalone Strength (Track 1), Standalone Running (Track 2), and The Hybrid Matrix (Track 3), along with the physiology that explains how the two systems collide—and how to make them reinforce each other.
Relative strength () is the cleanest way to compare force production across weight classes on the five fundamental compound barbell lifts—the exact core movements covered in StrongLifts 5x5 Workout and App: A Long-Term Review .
While most reference tables only list a 1-Rep Max (1RM), experienced lifters rarely test true singles outside of competition. In day-to-day training, a heavy 3-Rep Max (3RM)—which sits at roughly 91% to 94% of your 1RM—is a safer, far more repeatable benchmark.
Values are expressed as 1RM % of Bodyweight, with 3RM % of Bodyweight in parentheses.
| Lift | Novice | Intermediate | Advanced | Elite |
|---|---|---|---|---|
| Back Squat | 100% (93%) | 140% (130%) | 185% (173%) | 230%+ (215%+) |
| Bench Press | 75% (70%) | 100% (93%) | 135% (126%) | 170%+ (159%+) |
| Barbell Row | 65% (61%) | 90% (84%) | 120% (112%) | 145%+ (135%+) |
| Shoulder Press (OHP) | 45% (42%) | 60% (56%) | 80% (75%) | 100%+ (93%+) |
| Deadlift | 125% (117%) | 175% (163%) | 225% (210%) | 275%+ (256%+) |
| 3-Lift Total (S/B/D) | 300% (280%) | 415% (386%) | 545% (509%) | 675%+ (630%+) |
Formula Note: To convert any 3-rep top set into an estimated 1RM, use the Brzycki Formula () for a conservative estimate or the Epley Formula () for a standard estimate.
Raw strength matters less than how your lifts relate to one another. A structurally balanced lifter hits these internal ratios regardless of tier:
In distance running, raw top speed means little without knowing the aerobic engine behind it. Exercise physiologist Jack Daniels introduced VDOT—a unified score that combines your with your running economy (how efficiently you convert oxygen into forward motion) based on real race performances.
| Metric | Novice | Intermediate | Advanced | Elite (Sub-Elite Club) |
|---|---|---|---|---|
| VDOT Score | 32 – 35 | 40 – 45 | 50 – 55 | 62+ |
| 5 km Time | 28:30 – 26:00 | 24:00 – 21:30 | 19:30 – 18:00 | < 16:00 |
| 5 km Pace | 5:42 – 5:12/km | 4:48 – 4:18/km | 3:54 – 3:36/km | < 3:12/km |
| 10 km Time | 59:00 – 54:00 | 50:00 – 45:00 | 40:30 – 37:30 | < 33:15 |
| 10 km Pace (km) | 5:54 – 5:24/km | 5:00 – 4:30/km | 4:03 – 3:45/km | < 3:19/km |
| 10 km Pace (mile) | 9:30 – 8:41/mi | 8:03 – 7:14/mi | 6:31 – 6:02/mi | < 5:21/mi |
| Half Marathon | 2:10:00 – 2:00:00 | 1:50:00 – 1:39:00 | 1:30:00 – 1:23:00 | < 1:13:00 |
When you train for maximal force and aerobic endurance inside the same week, you run straight into three physiological realities:
Force production scales with muscle cross-sectional area, which is why specialist powerlifters eat in a surplus to add bodyweight. Distance running, however, penalizes every extra kilogram you carry against gravity across roughly 10,000 strides in a 10 km race (the exact same strength-to-mass tradeoff you feel hanging from a pull-up bar in Defy Gravity: How to Maximize Your Dead Hang Duration ).
Running a hard 10k creates eccentric micro-trauma in the quads and calves, depletes local muscle glycogen, and elevates AMPK—an endurance signaling pathway that can blunt hypertrophy if volume and nutrition go unmanaged. Conversely, a heavy Squat or Deadlift triple taxes the central nervous system (CNS) for up to 48 hours, making threshold intervals feel like running through wet cement the next morning.
Done carelessly, lifting ruins your run. Done properly, heavy triples and fives (3–5 RM) actually make you a faster, more resilient runner:
VDOT 40+) increases mitochondrial density and capillary blood flow, helping you clear metabolites and recover faster between heavy sets of squats and deadlifts.To qualify for a Hybrid Tier, an athlete must hit both the strength and running standards within the same 7-to-14-day window—not six months apart after dropping one sport to peak for the other.
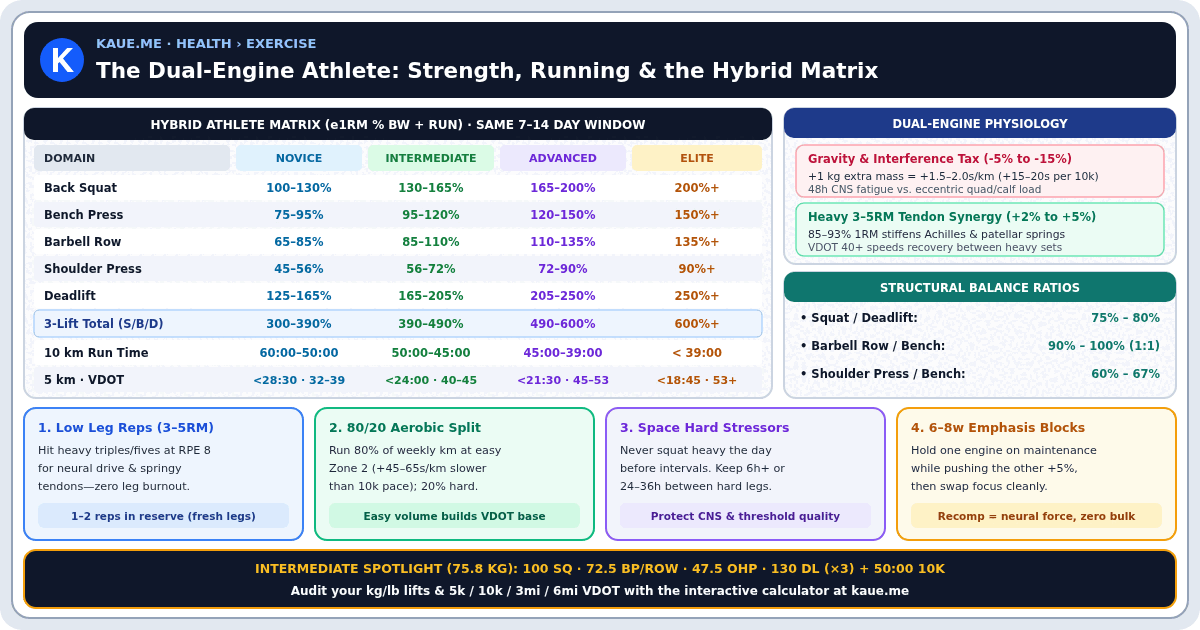
Because hybrid athletes carry upper-body musculature over distance while managing shared lower-body recovery, the Hybrid Matrix calibrates the upper tiers by roughly 5% to 15% relative to single-sport specialists.
Strength numbers show Estimated 1RM % BW, followed by 3RM % BW in parentheses.
| Domain | Novice Hybrid | Intermediate Hybrid | Advanced Hybrid | Apex / Elite Hybrid |
|---|---|---|---|---|
| Back Squat | 100–130% (93–121%) | 130–165% (121–153%) | 165–200% (153–186%) | 200%+ (186%+) |
| Bench Press | 75–95% (70–88%) | 95–120% (88–112%) | 120–150% (112–140%) | 150%+ (140%+) |
| Barbell Row | 65–85% (61–79%) | 85–110% (79–102%) | 110–135% (102–126%) | 135%+ (126%+) |
| Shoulder Press | 45–56% (42–52%) | 56–72% (52–67%) | 72–90% (67–84%) | 90%+ (84%+) |
| Deadlift | 125–165% (117–153%) | 165–205% (153–191%) | 205–250% (191–233%) | 250%+ (233%+) |
| 3-Lift Total (e1RM) | 300–390% BW | 390–490% BW | 490–600% BW | 600%+ BW |
| 10 km Run Time | 60:00 – 50:00 | 50:00 – 45:00 | 45:00 – 39:00 | < 39:00 |
| 10 km Pace | 6:00 – 5:00/km | 5:00 – 4:30/km | 4:30 – 3:54/km | < 3:54/km |
| 5 km Run Time | 28:30 – 24:00 | 24:00 – 21:30 | 21:30 – 18:45 | < 18:45 |
| Hybrid VDOT | 32 – 39 | 40 – 45 | 45 – 53 | 53+ |
Consider a 75.8 kg athlete hitting these numbers inside a single training week:
In a lifting gym, a ~327 kg (~4.3× bodyweight) 3-lift total is solid intermediate. In a running club, a 50-minute 10k is solid intermediate. Together in the same week, they form a textbook zero-bias hybrid profile: zero lower-body “runner’s lag” on the Squat and Deadlift (a 77% Squat-to-Deadlift ratio), exact 1:1 pushing and pulling symmetry (72.5 kg Bench and 72.5 kg Row) paired with balanced overhead strength (47.5 kg Press, 66% of Bench), and the aerobic engine to carry 75.8 kg at 12 km/h for 50 straight minutes.
Most aspiring hybrid athletes land in one of three buckets when they check their numbers against Track 3:
Get notified when I publish new essays, book summaries, and practical guides on living well. No spam—unsubscribe anytime.
Get the curated offline edition of Kaue's Way of Life—a practical field guide to optimizing 🍏 Health, 💰 Wealth, ❤️ Love, and 🧘 Meaning.
Challenge yourself to a fast 60-second quiz across 🔢 Math, 🌍 Geography, and 💬 Language—with replays, ghost races, and global leaderboards.
Have a question, perspective, or suggestion? Share your thoughts below. Comments are powered by GitHub Discussions (ad-free and spam-free)—click Sign in with GitHub below to comment or react (creating a free GitHub account takes less than a minute).
Updated on Nov 20, 2026.
DISCLAIMER: The content on this site is for informational and educational purposes only and does not constitute medical, psychological, financial, investment, tax, or legal advice. The ideas, curation, and opinions presented here are my own and do not represent those of my employer. Book, lecture, and article summaries are independent educational commentary and remain the intellectual property of their respective authors. AI tools may be used to assist with editing, formatting, and synthesis; while every effort is made to ensure accuracy, errors may occur. PRIVACY: This site uses no tracking cookies; browser local storage is used solely to remember optional language and playback-speed preferences, and hosting logs on Google Cloud process visitor IP addresses, browser metadata, requested resources, page engagement, and referral sources for aggregate traffic statistics. Third-party services used for optional newsletter subscriptions (Mailchimp), comments (giscus / GitHub Discussions), and media downloads/streaming (GitHub) may process visitor IP addresses and cookies in accordance with their respective privacy policies.